and a Cancel button
 .
If these are missing (for example in warnings and errors that require no user
decision), you should close the dialog using the standard Windows close button
in the upper right corner of the dialog window.
.
If these are missing (for example in warnings and errors that require no user
decision), you should close the dialog using the standard Windows close button
in the upper right corner of the dialog window.On this page I explain how the DANA software can be used to analyze actor networks. If you want to know more about what actor networks are and why one would want to analyze them, you should first read about the aim of the DANA project and preferably also read one of the early articles on DANA listed in the bibliography.
Once you have obtained the file DANA.zip from the DANA
Software page, the installation procedure is quite
simple:
C:\DANA.DANA.exe from the zipped
archive to this newly created DANA folder.DANA.exe on your desktop and/or include it in your
Windows Start menu.When you are connected to the Internet during start-up, DANA automatically checks to see if there is a newer version. If so, it will allow you to request it directly without having to go to the DANA Software page.
| NOTE: | The DANA software has been developed under Microsoft's Windows XP. It seems that it also works with older versions of Windows, but there may be differences in behavior. DANA makes use of the Windows web browser not only to locate folders and files on your computer and/or the World Wide Web, but also to display analysis results. Therefore, DANA will only function if Microsoft's Internet Explorer version 4 or higher is installed on your computer. |
Before taking you step by step through the process of modeling and analysis
of actor networks, I will introduce the graphical user interface of DANA. I
assume that you have basic knowledge of the Windows terminology (buttons, panes,
menu options, files, folders, etcetera) and that you have sufficient experience with
applications like Microsoft Word and PowerPoint to follow me when I point out
where DANA is similar to, or different from, these applications. I shall refer to
a dialog with its caption text, and to a button with the hint text that appears
when you move the mouse over it. Most dialogs will have an OK button
and a Cancel button
.
If these are missing (for example in warnings and errors that require no user
decision), you should close the dialog using the standard Windows close button
in the upper right corner of the dialog window.
DANA is a multi-window application. Its main window serves as a workspace that can contain several cases. A case in DANA is what a document is to Word. You can create or open, save and close cases using the corresponding File option of the main menu. An important difference between DANA and most other applications is that DANA stores each case in a folder instead of a file. This is because DANA cases are stored as Web pages, i.e., they are coded in HTML and contain icons and diagrams that need to be stored as separate GIF files. Therefore, when opening or saving a case, you have to specify the name of a folder.
DANA allows you to navigate your folders with the Select folder dialog shown below:
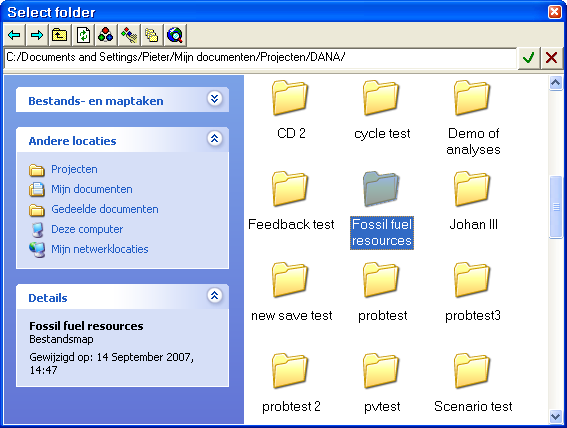
Upon opening, the text box at the top of the Select folder dialog shows the
folder that was last selected. This can be a file on your computer (e.g.,
C:/DANA/some_case)
http://www.dana.tudelft.nl/cases/some_case)
| NOTE: | I have found that in older Windows versions, double-clicking a folder causes a new Internet Explorer window to open. If this happens, close it and click on the Browse for folder on disk button of the Select folder dialog. A small dialog window will appear and let you browse for a folder on your computer. Alternatively, you can also type the folder name in the text field and then click the Refresh button to view it in the dialog window. |
When a folder contains a DANA case.htm
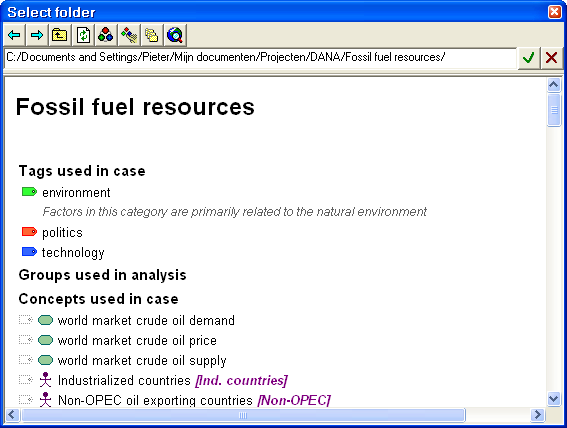
It may take a while for the case to appear, especially when you have a slow internet connection. You should click on the OK button on the right only when a case is shown. If you click on the OK button too soon, an error message may appear.
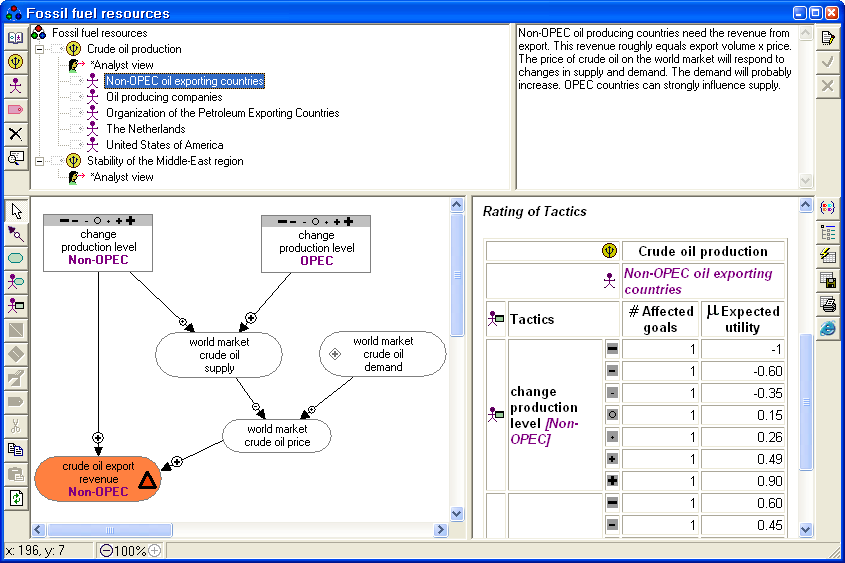
The selected Fossil fuel resources case can be found on the DANA Cases page. In this overview of DANA, this (small and oversimplified!) analysis of the problem of fossil fuel resources is used to illustrate the concepts and modeling approach of DANA.
Once loaded, a DANA case appears in a case view window. Like any multi-window application, DANA allows you to work simultaneously on more than one case. You can move case view windows around the main window, you can collapse them to tidy up your screen, or you can maximize one case view to get the largest possible editing area.
A case view is divided in four panes: the arena/dictionary pane (upper left), the comment pane (upper right), the graph pane (lower left) and the analysis pane (lower right). You can resize the panes by dragging the horizontal and vertical splitters. Note that each pane has its own set of buttons. Thus, the OK button and Cancel button only act on the comment pane; to close a case view, you should use the main menu option File|Close or click on the standard Windows close button.
The function of the four panes and their buttons will become clear as I introduce the basic concepts and modeling approach of Dynamic Actor Network Analysis in the following sections.
DANA is developed to support the analysis of complex policy problems. Such policy problems usually involve different issues that are linked (e.g., traffic congestion and road planning, or industrial development, nuclear waste and energy conservation). The linkages may be substantive (the issues have factors in common) as well as political (the issues have actors in common). DANA allows the analyst to separate the issues while retaining the possibility to analyze them as a single problem.
A problem is modeled as a case. In DANA, this is the highest level
entity, symbolized by a small DANA logo:
 .
Within a case, each issue is modeled as an arena, symbolized as a trident in a
sand-colored circle
.
Within a case, each issue is modeled as an arena, symbolized as a trident in a
sand-colored circle
 .
Cases should be given a name that reflects the total scope of the policy problem
(for example, "Fossil fuel resources"), whereas each arena name should be
characteristic for the particular issue addressed (for example, "Crude oil
production", "CO2 reduction", etcetera).
.
Cases should be given a name that reflects the total scope of the policy problem
(for example, "Fossil fuel resources"), whereas each arena name should be
characteristic for the particular issue addressed (for example, "Crude oil
production", "CO2 reduction", etcetera).
To add a new arena to a case, you must click on the Add arena button. The small Name of new arena dialog allows you to specify a name. Click on the OK button or press the Enter key, and the new arena will be added to the case.
To delete an arena from a case, select it and click on the Delete item button. DANA will ask you to confirm deletions, because if you delete an arena, you also delete all associated actor perceptions! Always be careful when deleting, because you cannot undo actions in DANA!
The actors that are defined for a case represent individuals, organizations or other groups. As the name implies, actors can take action.
Actors are added to an arena when they are stakeholders in the issue addressed in that arena. An actor is a stakeholder when his interests are affected when certain changes occur in the arena, regardless whether these changes occur due to either his own actions, the actions of other actors, or external developments. Not all actors need to be stakeholders: some actors may have the capability to cause changes in an arena but have no stake in the issue. If an actor can take action in an arena but is not a stakeholder, he is called an agent.
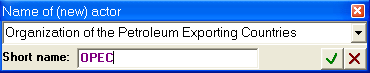
Stakeholders must be added explicitly to an arena. To do this, you first select the arena in the arena/dictionary pane and then click on the Add actor to arena button. In the dialog that appears (see below), you type the full name of the actor to be added in the first drop-down box. In case you already defined the actor for some other arena, you can selected it from the drop-down list. You will find that DANA "auto-completes" while you type. If the suggested name is not what you want, simply continue typing. As full actor names tend to be lengthy, DANA allows you to specify a short name in the smaller text box. This short name will be used to identify actors in perception graphs. If you specify no short name, DANA will always use the full name.
Agents are added implicitly to an arena when you define an action (see below) for a previously undefined actor. DANA automatically adds this new actor to the case dictionary, but the actor is not added as a stakeholder in an arena.
Factor is the generic term for concepts used to describe a policy issue. In DANA, there are three types of factors: system attributes, actor attributes, and actions. The word system is used to refer to "everything that the analyst considers to be relevant for the case". Thus, the system encompasses arenas, actors and factors. By default, a factor is a system attribute, i.e., it is a property of the system as a whole, rather than a property of a specific actor. In the fossil fuel example, the world oil market is clearly relevant for the case, but it is not an actor. Therefore, "world market crude oil price" is a system attribute. The "revenue from crude oil", on the other hand, is modeled as an actor attribute because there are several actors whose revenue is relevant to the case, and clearly the revenue for OPEC countries is not the same factor as the revenue for non-OPEC countries. The same argument also holds for actions: the action "change production level" that can be taken by OPEC countries is not the same factor as the action "change production level" that can be taken by non-OPEC countries.
To allow comparison of different actor perceptions within the same case, actors and factors are stored in a case dictionary. Within a case, each actor must have its own unique name. If the same actor name is used for stakeholders in different arenas, then DANA will consider these stakeholders to be the same actor. Thus, when OPEC figures in two arenas, it means that this one actor named OPEC holds a (possibly different) stake in these two arenas. The same holds for factors: if, for example, the factor "world market crude oil price" appears in two graphs that model the perceptions of two different actors, this means that these two actors perceive the same thing. In other words, the names you give to actors and factors serve as concept identifiers.
By default, the arena/dictionary pane displays the arenas that you
have defined for the case, and for each arena the stakeholders that you have
identified. You can view the case dictionary by clicking on the Switch to
dictionary view button
 .
The pane will then display all factors in alphabetical order, followed by all
actors, each with his attributes and actions. Note that the appearance of the
top button changes to
.
The pane will then display all factors in alphabetical order, followed by all
actors, each with his attributes and actions. Note that the appearance of the
top button changes to
![]() to indicate that it now lets you Switch to arena view. While in
"dictionary view mode", you can – if needed – change the name of the concepts you
defined earlier. Remember that the names uniquely identify concepts, so if you
rename an actor, its old name will be replaced in all arenas, and if you
rename a factor, all perception graphs that contain this factor will be
updated. Likewise, if you choose to delete a concept, it will be removed from
all arenas and perception graphs. DANA will ask you to confirm deletions,
because if you delete an actor, you also delete all its attributes and actions!
to indicate that it now lets you Switch to arena view. While in
"dictionary view mode", you can – if needed – change the name of the concepts you
defined earlier. Remember that the names uniquely identify concepts, so if you
rename an actor, its old name will be replaced in all arenas, and if you
rename a factor, all perception graphs that contain this factor will be
updated. Likewise, if you choose to delete a concept, it will be removed from
all arenas and perception graphs. DANA will ask you to confirm deletions,
because if you delete an actor, you also delete all its attributes and actions!
How actors view an issue is modeled in DANA with perception graphs. A perception graph is basically a cause map (Axelrod, 1976) with some additional features that will allow the analyst to capture for a particular actor:
and to subsequently study the logical implications of this particular actor perception.
Perception graphs are semi-qualitative models. Changes in factors are expressed
on a seven-point scale that ranges from a strong decrease via "no change" to a
strong increase, graphically depicted as minuses and plusses of different sizes
like this: 


One actor that is always involved in a policy analysis, but often overlooked
by policy analysts is the policy analyst herself. The analyst may have a
professional view on the policy issue addressed in an arena. Being only human,
she may even have a personal stakeholder perspective. In DANA, the professional
(detached, "objective") analyst view is set apart from the stakeholder views,
and is symbolized as
![]() .
It is optional. The analyst can use it for example to model the issue in
such a way that it best reflects the combined views of all stakeholders.
.
It is optional. The analyst can use it for example to model the issue in
such a way that it best reflects the combined views of all stakeholders.
In perception graphs, a goal associates a utility value with each of the
seven possible changes in a factor. These utility values are defined on a
semi-qualitative scale that ranges from a strong disapproval via "neutral" to a
strong appreciation, graphically depicted as faces like this:


 represents the highest positive emotion an actor can experience because of a
change in a single factor. If an actor has N goals, then he may
experience a positive emotion as strong as N times
,
or a negative emotion as strong as N times
.
represents the highest positive emotion an actor can experience because of a
change in a single factor. If an actor has N goals, then he may
experience a positive emotion as strong as N times
,
or a negative emotion as strong as N times
.
You can define a goal for a factor by first selecting it (click on the factor in the graph pane while in edit mode) and then clicking on the Define goal button. A dialog will appear like the one below:
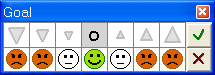
The preferred change is displayed against a colored background: silver for
"no change", blue if the actor would like to see a decrease, and orange if he
would prefer an increase. By default, the Goal dialog shows the "no change" goal.
As can be seen in the dialog above, the
(no change) is valued
positively (a smiling face), small changes are valued as neutral, and larger changes are valued
negatively.
You can change the preference by pressing the Left and Right arrow keys on your keyboard or by clicking directly on the preferred change icon. The Up and Down arrow keys allow you to specify how the actor values this change, as can be seen in the following dialogs.
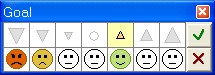
The Goal dialog on left corresponds to the goal defined for the factor "Revenue from crude oil [OPEC]" ("should preferably increase slightly") in our running case example. It is set by selecting the slight increase and then pressing the Down arrow once to indicate that the actor has only a weak preference for this change. The one on the right corresponds to the goal defined for the factor "Exploitable oil resources [OPEC]" ("should preferably not decrease"). It is set by selecting the decrease and then pressing the Down arrow several times until it shows that the actor prefers the factor not to decrease.
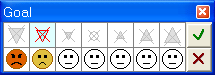
The Goal dialog supports quick entry of goals because it offers a choice from the "standard" utility vectors defined in DANA. It is also possible to define "custom" goals: you can set any "face" for each of the 7 change levels by clicking on the face icons. Clicking the left mouse button increases the utility value (happier face), clicking the right mouse button decreases it (sadder face). As can be seen in the following dialog, DANA chooses a symbol and color that would seem best reflect the custom vector: it chooses the change on the 7-point scale that yields the highest positive utility (in this case a small increase), or the least negative utility if there are no "happy faces". In that case, the goal reflects an undesirable change. To indicate that a goal is "customized", DANA underscores the goal symbol.
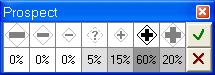
A prospect in a perception graph defines what "autonomous change the actor foresees to occur in a factor. A change is called "autonomous" when it is the result of external developments, or in other words, when it is not caused by some action in the perception graph.
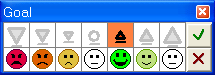
You can define a prospect for a factor by first selecting it (click on the factor in the graph pane while in edit mode) and then clicking on the Define prospect button. If no prospect has been defined for the factor yet, the following dialog will appear:
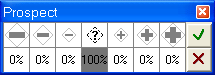
You define a prospect by selecting (using the mouse or the Left and Right arrow keys) the change that the actor expects to occur in the selected factor. The Up and Down arrow keys allow you to model uncertainty. The following Prospect dialog, for example, corresponds to the goal defined for the factor "World market crude oil demand" in our running case example. It is set by selecting the standard increase and then pressing the Up arrow several times to increase the uncertainty of the prospected change. Pressing the Down arrow will reduce the uncertainty.
Actions reflect the capability of actors to cause changes in the system. Actors are assumed to have full control over their actions, but there may be certain constraints on the range of changes that an action may achieve. For example, if the analyst assumes that the non-OPEC countries are already producing at the limits of their capacity, she can model this by reducing the feasible action range for the action "change production level" of this actor. Such reduction is achieved by clicking on the action range bar along the top of the rectangle that represents this action. Clicking on one of the seven change icons will change its color from black to white or vice versa. Black indicates that this change is feasible, i.e., that the actor can take the action in such manner that it causes this change. White indicates that this change is not feasible.
If a change in factor A is believed to cause a change in factor B, the
change in B is the result of the change in A and the type of causal relation
between A and B. The relation A
 B may
affect the direction of a change (an increase in factor A may cause a decrease
in factor B) as well as amplify or reduce changes in chain of cause and effect.
In other words, the arrow functions as a change multiplier. Change multipliers
are defined on a semi-qualitative scale that ranges (in both directions) from
"reduced effect" via "same effect" to "amplified effect". It may seem logical to
leave out "no effect", because you can model that by simply not drawing a link
from A to B. But sometimes, you want to capture that the influence of A on B is
uncertain and may range from a bit negative to a bit positive. That is why the
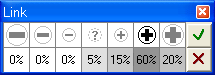
middle option is available in the default Link dialog below:
B may
affect the direction of a change (an increase in factor A may cause a decrease
in factor B) as well as amplify or reduce changes in chain of cause and effect.
In other words, the arrow functions as a change multiplier. Change multipliers
are defined on a semi-qualitative scale that ranges (in both directions) from
"reduced effect" via "same effect" to "amplified effect". It may seem logical to
leave out "no effect", because you can model that by simply not drawing a link
from A to B. But sometimes, you want to capture that the influence of A on B is
uncertain and may range from a bit negative to a bit positive. That is why the
middle option is available in the default Link dialog below:
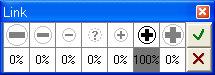
To call up the Link dialog, you must first specify which factor models the cause and which factor models the effect. To do this, you first switch from "edit mode" to "link mode" by clicking on the Switch to link mode button. Then move the cursor over the cause factor, press the left mouse button and keep it down, drag the mouse over to the effect factor, and release the mouse button. The Link dialog then appears and behaves quite similar to the Prospect dialog: you click on the change multiplier that reflects the most probable influence that a change in the cause factor will have on the effect factor, and then (if necessary) change the uncertainty of this influence using the Up and Down arrow keys.
You will notice that DANA automatically switches back to "edit mode" after adding a link. I found that in most cases, drawing a link is followed by editing actions, rather than adding more links. But if you must draw many links, you can also do this by dragging on a factor while holding down the Alt key on your keyboard. DANA will then switch to link mode automatically.
As you are drawing a perception graph, you will find that causal links come together in two different ways: in sequence and in combination. When two links are placed in sequence as shown below, this means that the change in factor B will equal the change in factor A, modified (i.e., possibly amplified, reduced or inverted) by the change multiplier u of the first link, and that the resulting change in C will then equal the change in B modified by the change multiplier v of the second link.

Because changes and change multipliers may be probabilistic, the modification is not a straightforward multiplication (×), but a probabilistic vector multiplication for which I will use the symbol Ä. The meaning of the above sequence of two links is defined by these equations:
DB = DAÄu and DC = DBÄv
so for the entire sequence:
DC = DAÄuÄv
When two links are combined as shown in the next figure, this denotes that when factor A and/or factor B change, the resulting change in factor C will be equal to the sum of the changes in A and B, modified by the change multipliers of the respective links.
Because changes may be probabilistic, their combined effect on C cannot be calculated by a simple addition (+) of two values. Instead, a probabilistic vector addition is used, which I denote with the symbol Å. The meaning of two causal links coming together in a single factor as shown above is defined by this equation:
DC = DAÄu Å DBÄv
For more details on how DANA computes changes, see the sub-section on semi-quantification on this page.
To edit a graph, first switch to "edit mode" (this is the default setting).
You can select a factor or a link by clicking on it. Selected items are outlined in purple. To select more than one item, select one item and then click on the next items while holding down the Shift key on your keyboard. Shift-clicking a selected factor will de-select it again. To select the entire graph (all factors and links), select one item and then press Ctrl-A or choose the Edit|Select All option from the main menu.
You can change the position of a single factor in a perception graph simply by dragging it; DANA will automatically adjust the link arrows. To move several factors as a group, select all but one of these factors (by Shift-clicking them) and then – still holding down the Shift key – select the last factor and start dragging it; the other factors will move along while maintaining their relative position to the factor being dragged.
You can remove selected factors and/or links by clicking on the Cut button on the left of the graph pane. If you cut away a factor, you also remove its connecting links. You can use the Copy and Paste buttons to copy (parts of) one perception graph to an other perception graph. If the graph to which you paste already contains some of the selected factors and links, these are not duplicated. Copy/paste will also work if the two graphs belong to different arenas or even to different cases!
| NOTE: | You can use the Paste button to undo the previous cut. The Cut and Paste buttons will function only when one or more items have been selected, but the Copy button will work even when nothing is selected. This is because copy not only prepares for paste, but also copies the selected part of the perception graph onto the Windows clipboard. This allows you to copy a high-quality image of a perception graph into a Word document or PowerPoint presentation. |
For information on how to add/edit factors, links, prospects and goals, I refer to the previous section.
Policy problems are complex, and DANA models try to address this complexity, rather than ignore it. By consequence, DANA models tend to become complex as well. I therefore strongly urge you to document your models as you construct them. DANA supports this by allowing you to add comments to virtually all parts of your model.
Comments are associated with items, i.e., arenas, actors, etcetera. To enter a comment for some item, simply select the item and then click on the Edit comment button on the right of the comment pane. The pane color will change to pale green to indicate that it is no longer "read only". After typing the comment text, click on the Accept changes button to store it.
Although they have the same icon, actors in the dictionary and stakeholders in an arena are two different types of items. When you have selected an actor while in "dictionary view mode", the comment you type is associate with the actor itself, regardless of its role in whatever arena. Use this comment to describe his basic properties. When you have selected an actor while in "arena view mode", the comment you type is associated with his stakeholder role in the chosen arena. Use this comment to outline his perception on the issue addressed in this arena, and his position relative to other stakeholders in this arena.
A similar distinction is made between factors in the dictionary and factors in a perception graph. Use the comment associated with the dictionary item to document its generic definition, and use the comment associated with the (rounded) rectangle in a perception graph to describe how the actor of the perception graph perceives this factor, e.g., if it is a goal: why does he wish to see it change? and if it is a prospect: why does he expect it to change? and for other factors: why does he see this to be part of the problem?
Because people often forget to click on the Accept changes button, I have programmed DANA to check for an active comment pane whenever you select an item in the arena/dictionary pane or the graph pane. If the comment pane is still active, DANA will prompt you whether you want to keep the new comment.
| NOTE: | When you click the Edit comment button, the rightmost field of the status bar at the bottom of the case window will specify the object for which you are editing the comment. |
Comments are stored in the DANA case.htm
DANA allows you to perform a range of analyses on a case. You can select the type of analysis to be performed by clicking on the Configure analysis button on the right of the analysis pane. The following dialog will appear:
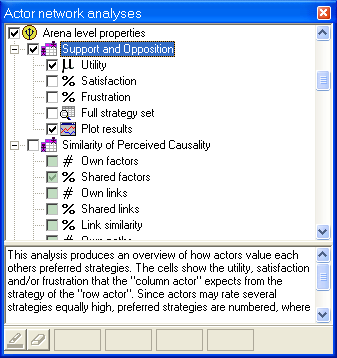
Configuring an analysis means
that you tell DANA which tables it should write to the file Analysis.htm
in the case folder. In the upper pane of the dialog, you will see a structured
list showing the tables that DANA can generate. The table icons indicate the
type of analysis:
 for factor properties like relevance and connectivity
 for factor-factor properties like causal influence
 for actor-actor properties like resource dependency
... etcetera
Each table has a number of fields that you can select to be included as columns in the table. The field icons indicate the type of field:
 |
a count, such as the number of occurrences of, or goals associated with, a factor |
 |
a ratio, usually a count divided by the number of perception graphs included in the analysis; also used to denote values that are always percentages, such as satisfaction and frustration |
 |
an aggregated value, such as the sum of utilities |
 |
a mean value, usually an aggregated value divided by the number of perception graphs included in the analysis |
 |
the standard deviation from the mean |
 |
a change in a factor, or rather: the probabilities of each of the
seven possible changes
), |
 |
a tactic, i.e., a single change associated with an action |
 |
a goal, i.e., the utilities associated with each of the seven possible changes, visualized as a histogram |
 |
table details: when checked, detailed information is added to the table in a way that may be different for different tables |
As you browse through the list, the lower pane will display a brief description of the selected table or field. You can select a particular table by clicking on the checkbox left of the corresponding table icon. When you deselect a table (or one level higher, a category of tables), the selected fields (tables) will not be included in the report, but remain checked.
| NOTE: | I am still discovering new ways in which a collection of perception graphs can be analyzed, as well as
better ways to present the outcome. New analyses and reports will find their way to you as I publish new releases of DANA. |
The analysis pane of a case view window actually is an embedded web
browser that will display the file Analysis.htm that DANA generates
when you click on the Perform analysis button. Tables will be displayed
according to standard conventions for displaying HTML tables. As tables tend to
become large, relevant information can easily be overlooked. Therefore, DANA
allows you to define conditional formatting rules for numerical fields (i.e.,
all fields except changes, tactics and goals) in a way that is quite similar to
conditional formatting in Microsoft Excel.
You can define up to four conditional formats for a field. To define a formatting rule for a field, select this field in the Actor network analyses dialog, click on one of the active (dark framed) format boxes, and then click on the Change conditional format button on the left. The following dialog box will appear:
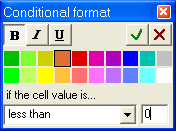
You can change the font format by clicking on one or more of the buttons in the upper left corner, and you can change the background color for the cell by clicking on the color of your choice. You must then specify the condition for the cell value that, when met, will make DANA apply the format to the table cell. So according to the dialog above, the values in the selected field column will be displayed in bold face against an orange background if they are less than zero.
| NOTE: | If you specify more than one condition for a field, DANA will evaluate them from left to right and apply the format of the first condition that evaluates as true. |
Many of the analyses that DANA can perform produce interesting results only when applied to groups of perception graphs. For example, the relevance of a factor in terms of the number of actors who have included this factor in their perception will not be very informative for a single perception graph, because the value will be either 1 or 0. Moreover, there may be factors that are different, but address the same aspect (e.g., economics) of the issue at hand. DANA therefore allows the analyst to define groups for factors, actors and arenas in various ways. This grouping is achieved by defining so-called 'tags' that can then be used to label concepts. Once labeled with one or several tags, concepts having the same tag(s) constitute a group.
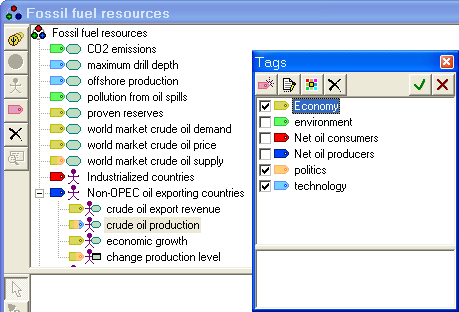
You can define new tags (and rename existing ones, if needed) by clicking on the Tag item button on the left of the arena/dictionary pane. The Tags dialog will appear as shown below:
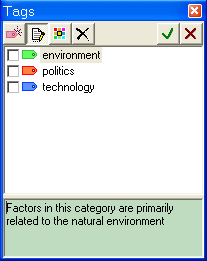
You can add a tag to the list by clicking on the Add new tag button. A new tag will appear (typically called something like "New tag 3") with a gray color. Then proceed with the following steps:
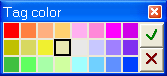
| NOTE: | On some computers, the Tag color dialog seems to be not working: the tag stays gray. I have found that this happens for certain Windows display settings. Read the corresponding FAQ item for workarounds. |
Having defined one or more tags, you can start labeling concepts. Factors and actors can be labeled when the arena/dictionary pane is in dictionary mode (see below). To call up the Tags dialog, select a concept and click on the Tag concept button, or (even faster) click once on the (blank) tag symbol immediately to the left of the concept. In the Tags dialog, check the tags you wish to attach to the concept and click on the OK button. When you have checked more than one tag, DANA will try to paint the tag symbol striped in the colors of all of the selected tags, but obviously there is an upper limit (to the number of colors only, not the number of tags you may select simultaneously!).
Having tagged the factors, you can define factor groups that you can then use in your analyses. You do this by clicking on the Define groups button on the right of the analysis pane. The Grouping for analysis dialog will appear. This dialog features separate tabs for arena groups, actor groups and factor groups. If, for example, you want to compare the relevance of factors related to technology and the environment with factors related to the economy and politics, you can define these groups as follows:
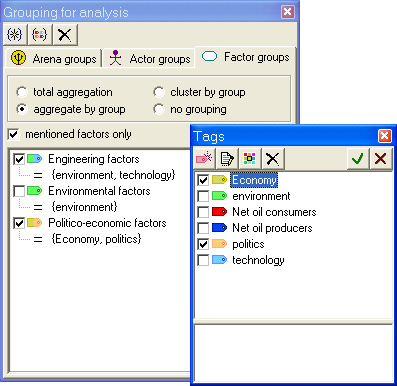
As you can see, the tag symbols of the groups are striped in the colors of the checked tags, while underneath the names of the checked tags are shown between braces {...}. I have chosen for this notation, because it is conventional to denote a set (in the mathematical sense) as a pair of braces that include the elements of the set separated by commas. This notation reflects that a group in DANA is defined by a set of tags.
To define arena groups and/or actor groups, you follow a similar procedure.
When concepts are aggregated by group as defined in the example I just used, the first lines in the results displayed in the analysis pane will specify the chosen types of aggregation and/or clustering:
Although I have presented DANA as a tool to support analysts in making
qualitative models of actor perceptions, you must have noticed that the
7-point scales for changes, change multipliers, and utility are at least ordinal
scales. Indeed, DANA does internally convert qualitative values such as  ,
,
 and
into numerical values, and uses these values to compute the required analysis results.
The tables below show what values correspond to the qualitative values:
and
into numerical values, and uses these values to compute the required analysis results.
The tables below show what values correspond to the qualitative values:
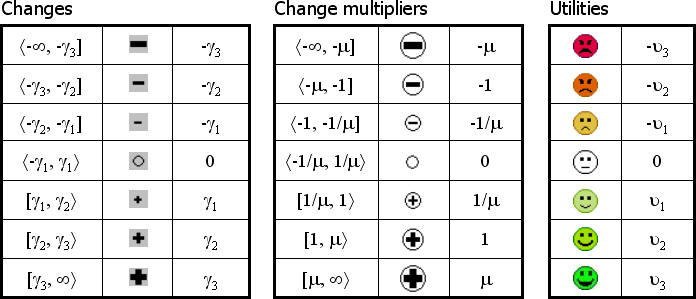
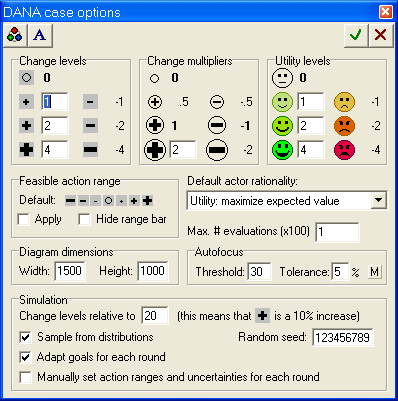
By default, m = 2, g1 = 1, g2 = 2, and g3 = 4, and u1 = 1, u2 = 2, and u3 = 4 as well.
While computing results, DANA will postpone truncation until the last
moment. This means that in the sequence  B
C
B
C  D.
Even if the change in A is small (say, for example,
, which by default is
translated to the numerical value +1), it will still be reduced to 0.5 by the
first link, reduced even further to 0.25 by the second link, but then amplified
again to +1 by the third link. Only then does DANA convert the resulting
numerical value back to a change on the 7-point scale, so according to the first
table, a change of in A will cause a
change of in D.
D.
Even if the change in A is small (say, for example,
, which by default is
translated to the numerical value +1), it will still be reduced to 0.5 by the
first link, reduced even further to 0.25 by the second link, but then amplified
again to +1 by the third link. Only then does DANA convert the resulting
numerical value back to a change on the 7-point scale, so according to the first
table, a change of in A will cause a
change of in D.
The default values for changes, change multipliers and utility values can be changed by selecting
the
| NOTE: | A complete documentation of the way in which DANA computes (probabilistic) causal influence can be found in (Bots, 2007a). |
As a case becomes larger, its loading and saving times will increase proportionally. Most analyses will also take a proportional amount of time, but for some (actor-actor analyses, for example) the time will increase quadratically or even exponentially. Because utility functions may not be convex, inferring the best and worst strategies involves an investigation of all possible combinations of tactics. For a perception graph with 3 actions with the full action range, this means 7×7×7 = 347 possible strategies; for a graph with 6 actions, more than 100 thousand strategies need to be evaluated, and for 10 actions over a billion.
To keep DANA from locking into a loop with billions of iterations, the software samples the strategy space instead of evaluating all possible combinations of tactics. I have found that for complex perception graphs, a great many combinations of tactics will, due to cumulative effects, cause the same changes in the goal factors. In such cases, even a tiny sample of the strategy space may contain one or several strategies that yield high goal satisfaction, if not maximum. By default, DANA presently imposes an upper limit of 100 on the number of strategies to evaluate when searching for the ideal strategy for a perception graph. You can change this limit in the DANA case options dialog.
DANA samples the solution space by "virtually" enumerating the strategies.
For each action in the perception graph, DANA first checks whether it has a
non-zero impact on one or more goal variables. If not, DANA assumes
(no change) for this
action in all strategies. DANA then checks the feasible action range. If this
range contains no feasible tactics, DANA also assumes
, and if it contains
only one feasible tactic, this one is assumed to be part of all strategies.
Clearly, this can significantly reduce the strategy space to be sampled. Next,
DANA "identifies" all remaining strategies with a number between 0 and
There are two ways to guide DANA in its search for the ideal and/or worst
case strategies for a perception graph. One way is to limit the
feasible action range. If you'd allow only , and
as possible changes,
then a full search of the strategy space for 10 actions will require "only" 310 ≈ 60 thousand evaluations.
By default, DANA assumes the full range of changes as feasible, but you can
change this in the DANA case options dialog. If you check the Apply
box, DANA with change the feasible action range of all actions in all
perception graphs to the new setting.
The other way is to selectively reduce the complexity of your perception graphs. It may seem terrible to have to strip a beautifully detailed perception graph down to the bare essentials, but please consider this: A large, complex diagram is also difficult to grasp by others. Maybe you are trying to capture a set of related issues in a single perception. If so, try to identify these issues and model them in separate arenas.
Expecially when you work with prospects and uncertain links, the results produced by DANA analyses will be difficult to check. To facilitate exploration of a perception graph, DANA features a Quick analysis window that can display some of the properties that DANA infers when performing analyses: the influence of one factor on another, the utility, satisfaction and frustration (USF) that result from a specific tactic, the "noise" (changes caused by prospects) for a factor, and the four types of conflict that can exist between two actor perceptions. Some future version of DANA will also show the strategies inferred for a particular actor.
The two figures below illustrate the use of the Quick analysis window: First, this window is called up by clicking on the Quick analysis button  on the left of the arena/dictionary pane. For convenience, this window will always stay on top of the case windows. Note that you have to check the information items you wish to see.
In the first figure, the OPEC's attribute "Exploitable oil resources" has been selected (by clicking on it). The contents of the information pane show that when the cursor is moved over any other factor, the analysis pane tells you how many paths lead from this factor to the selected (i.e., purple-rimmed) one, and how strong the cumulated causal influence of these paths is. Moreover, when the cursor is moved over the range bar of an action (and becomes a pointing hand), the utility, satisfaction and frustration (USF) that result from the change that is pointed at (in this case ) are also shown.
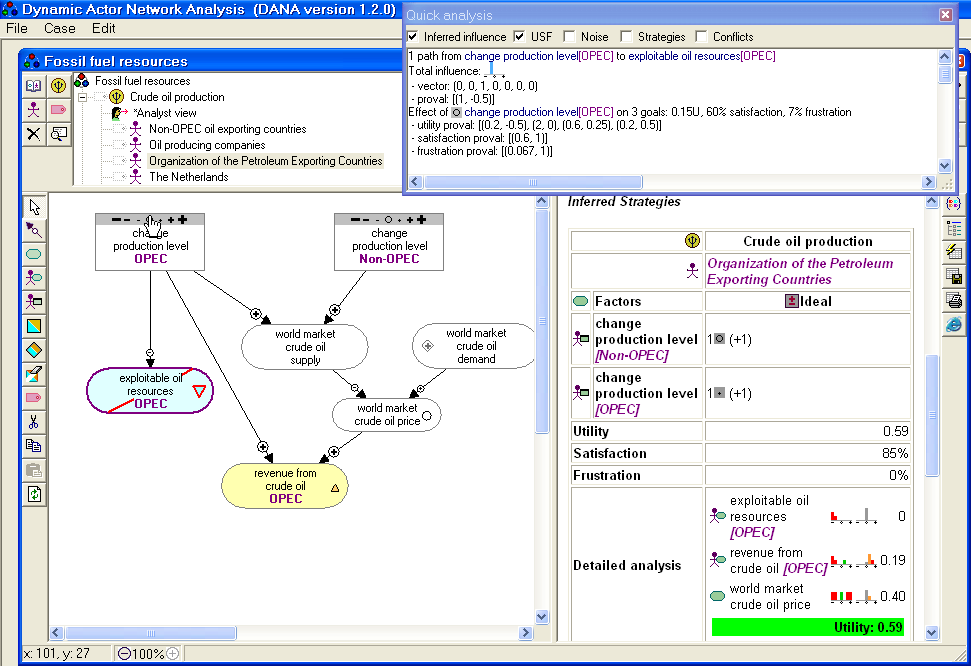
| NOTE: | Even though the chosen tactic is "no change", the goal factor changes due to the prospect defined for "world market crude oil demand". |
In the next figure, another goal in the perception graph is selected, and the mouse is moved over the range bar of another action.
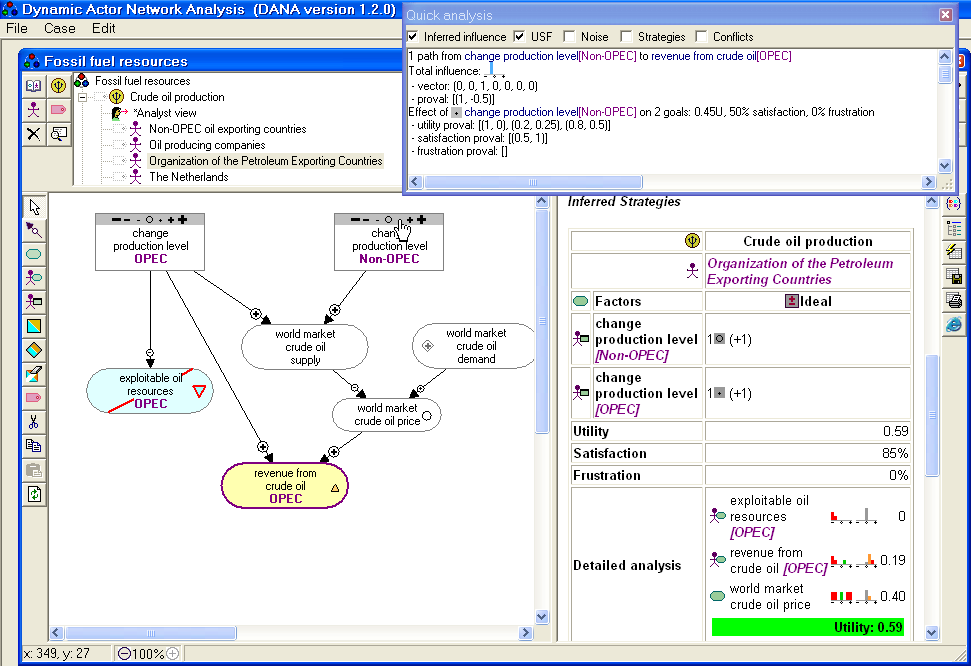
| NOTE: | The utilities as shown in the Quick analysis dialogs in the two figures above are probabilistic because of the uncertainty in the prospect. The table in the analysis pane of both figures show the expected utilties for the three goal factors. Presently, DANA cumulates utility provals in such a way that the sum of the probabilities equals the number of goals. I'm still working to improve the way DANA computes the utilities when multiple tactics and multiple goals are involved. |
DANA cases are stored in folders to allow the use of GIF images and
to store files containing the results of analyses. Each time you click on the
Perform analysis button, DANA overwrites the file Analysis.htm
in the case folder. To preserve the results shown in the analysis pane,
you must click on the Save report to file button. DANA will then prompt
you for a file name.
| NOTE: | You cannot open saved reports with DANA. To view
saved results of previous analyses, you will have to open the files with
your normal web browser. A practical workaround is to click on the
View report with Internet Explorer button on the right of the analysis pane. This will open a
web browser on the file Analysis.htm in your current case folder.
Then simply edit the name in the address bar of this browser. |
Presently, DANA offers no specific group support facilities, but I can give you some suggestions for working together efficiently with DANA.
You can share cases by making the folders they are stored in accessible to your colleagues. You could also use a web page on Internet (or some intranet) to publish your work, since DANA can also load a case specified by some URL. You can of course also send cases by mail.
| NOTE: | When DANA opens a case, it
only reads the HTML file DANA case.htmDANA case.htm |
If you and your colleagues work concurrently on the same policy issue, you may wish to merge actor perceptions from different case files into a single case. Presently, you will have to do this by opening the source cases in different case views and use Copy and Paste. DANA does support copy/paste from one case to another, but obviously DANA does not understand that two factors named "oil price" and "price of crude oil" are likely to refer to the same concept. Therefore, it is wise to standardize your terminology, for example by appointing someone as "dictionary manager" and let him/her maintain a "base case" that can be accessed by all group members.
To facilitate integrating different perception graphs, DANA now facilitates resolving synonyms and antonyms. To automatically "merge" F into "G", that is, to replace all occurrences of factor F (e.g., "oil price") by factor G (e.g., "price of crude oil"), you do the following:
 to switch to "dictionary view mode"
 to switch back to "arena view mode"
| NOTE: | When thus "merging" two factors, DANA may modify goals, prospects and/or links:
When a perception graph contained a goal for F and not yet for G, then this goal (desired change) will now be defined for G. The same holds for prospects. Likewise, all links x→F and F→x are converted to x→G and G→x, respectively, except when
|
If you have checked the Change signs box in the Similar factors dialog, the goals, prospects and links associated with F and G will be modified: desired/expected increases for F become decreases and vice versa, and the sign of the link multipliers changes. The probability distribution (for uncertain links and prospects) and utility levels (for goals) remain the same.
| NOTE: | When "merging" similar factors F and G, the type of G (factor, attribute or action) remains the same even when F is an action or attribute. |
In some future version, I plan to also implement a "drag and drop" feature that will allow you to import actor perceptions, analyst views, and even complete arenas from another case while preserving name uniqueness.
To download a case from the web, select the File|Open menu option, click the web site button, select the case you want, and when its URL shows in the text field of the dialog, click the OK button. You may have to wait a while until the new case window appears. You can then proceed as you would with any case. Upon closing, you will be prompted for a folder name in which to save it on your own computer.
You can contribute to the DANA community by submitting cases that you have analyzed. Cases can be submitted using the Case|Submit for Publication menu option of the DANA software. DANA will contact the site and upload your case, but it will not appear automatically in the list of published cases. To maintain a balance between quality, quantity, variety and didactic value, your submissions will be reviewed before being published. The review process may take some time, so please be patient. Do not upload the same case twice!
Last update 2009-02-03